 |
|
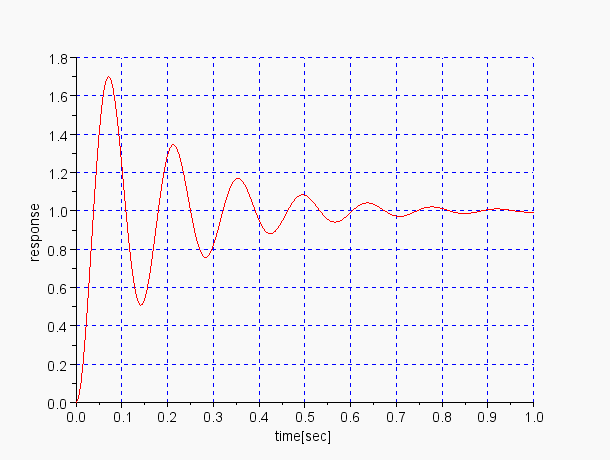
P動作のステップ応答 control=1,graph=1 |
 |
|
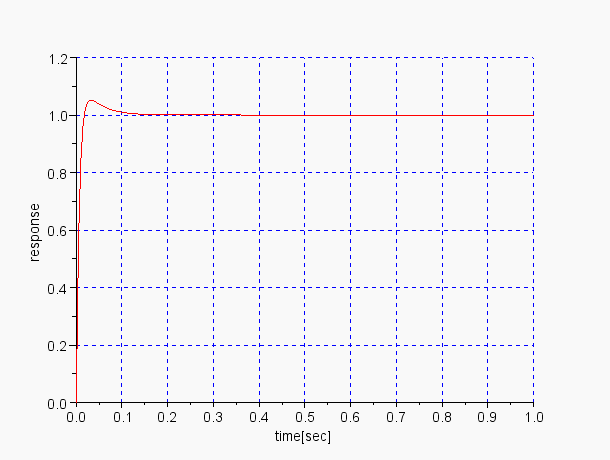
PD動作のステップ応答 control=2,graph=1 |
 |
|
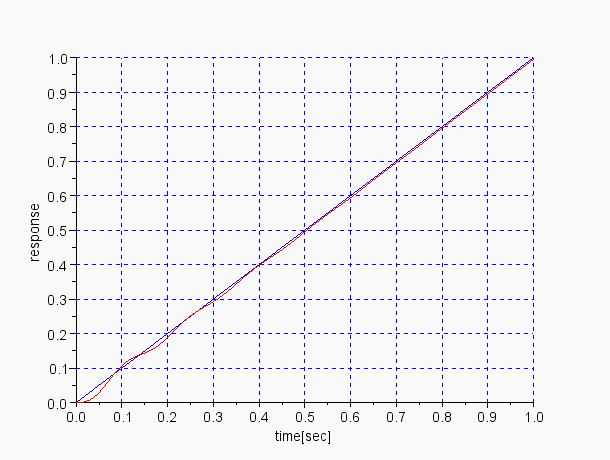
P動作のランプ応答 control=1,graph=2 |
 |
|
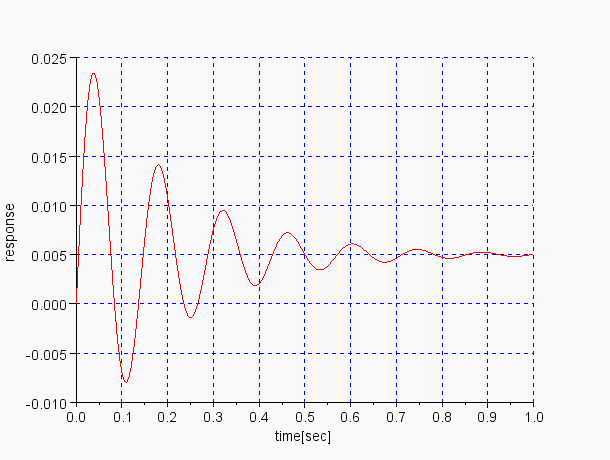
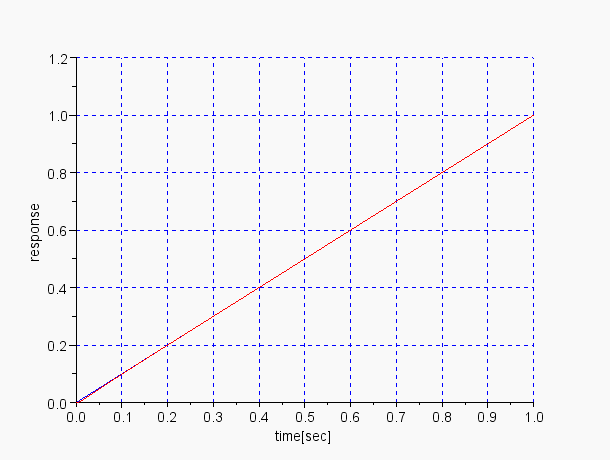
P動作のランプ応答の誤差,定常偏差が見える control=1,graph=3 |
 |
|
PID動作のランプ応答 control=3,graph=2 |
 |
|
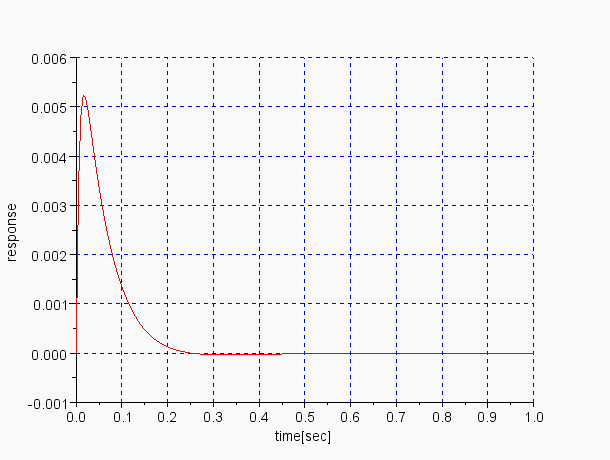
PID動作のランプ応答の誤差,定常偏差が0になっているのがわかる |
制御工学への応用その3
Copyright (C) 29Feb2004 coskx
last
update Jan2012
【1】制御工学への応用
この文書はScilabの制御工学への応用を紹介をしています。
【2】DCモータ制御モデル (その1)
小型DCモータはL成分が小さいため,「入力:電圧,出力:角変位」とすると,伝達関数が次のようになります。
Km
Gm = ------------------
s ( Tm s + 1 )角度変位をフィードバックするとして,PID制御要素を導入することにすると,PID制御要素は次のようになります。
1
K= Kp * ( 1 + Td s + ------ )
Ti sここで次のような直結ネガティブフィードバックを考えます。
+ ----- ------
-----o----->| K |---->| Gm |----*----->
- | ----- ------ |
-------------←---------------そして等価変換した伝達関数を次のように記述します。
---------
------>| Trans |---->
---------これは
K Gm
Trans = -----------------
1 + K Gm
となります。ここで具体的に,Tm =0.1 Km = 20 を想定して,P制御,PD制御,PID制御の場合を考えます。
毎回Scilabのウインドウに記述するのは面倒なので,Scilabの専用エディタSciPadで以下のファイルをつくり,controlとgraphに値を代入して,SciPadより実行します。なおKp,Td,Ti(Kiは1/Tiですが,Ki=0の場合はKiで記述)も変更可能です。controlの値は次のように使っています。
1:P制御
2:PD制御
3:PID制御
graphの値は次のように使っています。
1:Transの単位ステップ応答
2:Transの単位ランプ応答
3:Transの単位ランプ応答の誤差の拡大図
4:TransのBode線図計算された値は,そのまま実際のDCモータの応答とは一致しません。
制御部が出力する電圧が計算どおりにならず,電源の電圧・電流で制限を受けるためです。
そのためステップ応答の起動部分がまったく合いません。電源モデルを取り込んだ解析が必要です。
しかし,PIDの各要素が収束する部分に与える影響を調べるには有効です。
control=1; //1:P 2:PD 3:PID
graph=1; //1:step 2:ramp 3:ramperror 4:Bode 5:NyquistTm=0.1;
Km=20;
s=poly(0,'s');
Gm=Km/s/(Tm*s+1);if control==1 then
Kp=10;
Td=0;
Ki=0;
elseif control==2 then
Kp=20;
Td=0.040;
Ki=0;
else
Kp=20;
Td=0.040;
Ti=0.150;
Ki=1/Ti;
end
K=Kp*(1+Td*s+Ki/s);
GmK=Gm*K;
Trans=GmK/(1+GmK)
roots(denom(Trans))clf();
mySys=syslin('c',Trans);
if graph==1 then
t=[0:0.005:1];
y=csim('step',t,mySys);
plot2d(t,y,5)
plot2d(t,y,5)
elseif graph==2 then
deff("[zramp]=ramp(x)","zramp=x"); //definition of ramp function
t=[0:0.005:1];
y=csim(ramp,t,mySys);
y1=ramp(t);
plot2d(t,y1,2)
plot2d(t,y,5)
elseif graph==3 then
deff("[zramp]=ramp(x)","zramp=x"); //definition of ramp function
t=[0:0.005:1];
y=csim(ramp,t,mySys);
y1=ramp(t);
y2=y1-y;
plot2d(t,y2,2)
plot2d(t,y2,5)
elseif graph==4 then
bode(mySys);
elseif graph==5 then
nyquist(syslin('c',GmK));
endif graph ==4 then
f=get("current_figure");
f.children(1).grid=[2 2];
f.children(2).grid=[2 2];
f.children(1).labels_font_size=2; //目盛の数字
f.children(2).labels_font_size=2; //目盛の数字
f.children(1).x_label.font_size=2;
f.children(2).x_label.font_size=2;
f.children(1).y_label.font_size=2;
f.children(2).y_label.font_size=2;
f.children(1).y_label.auto_position="off";
f.children(2).y_label.auto_position="off";
f.children(1).y_label.auto_position="on";
f.children(2).y_label.auto_position="on";
elseif graph<4 then
a=get("current_axes"); //get the current axes
a.grid=[2 2]; //make x,y-grid
a.labels_font_size=3; //目盛の数字
a.x_label.text="time[sec]";
a.x_label.font_size=3;
a.y_label.text="response";
a.y_label.font_size=3;
end
【3】DCモータ制御モデル(その1)で得たいくつかのグラフ
P動作のステップ応答 control=1,graph=1
PD動作のステップ応答 control=2,graph=1
P動作のランプ応答 control=1,graph=2
P動作のランプ応答の誤差,定常偏差が見える control=1,graph=3
PID動作のランプ応答 control=3,graph=2
PID動作のランプ応答の誤差,定常偏差が0になっているのがわかる
control=3,graph=3
【4】DCモータ制御モデル (その2)
小型DCモータはL成分が小さいため,「入力:電圧,出力:角変位」とすると,伝達関数が次のようになります。
Km
Gm = ------------------
s ( Tm s + 1 )振動を抑えるために,速度フィードバックをマイナーループで入れることにします。
+ ------
-----o--->| Gm |----*----->
- | ------ |
| ------ |
----| Kd s |←--
------
これを等価変換して,Gm1とするとGm
Gm1= --------------
1 + Gm Kd sとなります 。角度変位をフィードバックするとして,PI制御要素を導入することにすると,PI制御要素は次のようになります。なおKdを正規化するために Kd = Kp × Td とします。
1
K= Kp * ( 1 + ------ )
Ti sここで次のような直結ネガティブフィードバックを考えます。
+ ----- ------
-----o----->| K |---->| Gm1 |----*----->
- | ----- ------ |
-------------←---------------そして等価変換した伝達関数を次のように記述します。
---------
------>| Trans |---->
---------
これは
K Gm1
Trans = -----------------
1 + K Gm1
となります。ここで具体的に,Tm =0.1 Km = 20 を想定して,P制御,PI制御の場合を考えます。
毎回Scilabのウインドウに記述するのは面倒なので,Scilabの専用エディタSciPadで以下のファイルをつくり,controlとgraphに値を代入して,SciPadより実行します。なおKp,Td,Ti(Kiは1/Tiですが,Ki=0の場合はKiで記述)も変更可能です。controlの値は次のように使っています。
1:P制御
2:PD制御
3:PID制御
graphの値は次のように使っています。
1:Transの単位ステップ応答
2:Transの単位ランプ応答
3:Transの単位ランプ応答の誤差の拡大図
4:TransのBode線図計算された値は,そのまま実際のDCモータの応答とは一致しません。
制御部が出力する電圧が計算どおりにならず,電源の電圧・電流で制限を受けるためです。
そのためステップ応答の起動部分がまったく合いません。電源モデルを取り込んだ解析が必要です。
しかし,PIDの各要素が収束する部分に与える影響を調べるには有効です。
control=1; //1:P 2:PD 3:PID
graph=1; //1:step 2:ramp 3:ramperror 4:Bode 5:NyquistTm=0.1;
Km=20;
s=poly(0,'s');
Gm=Km/s/(Tm*s+1);if control==1 then
Kp=10;
Td=0;
Ki=0;
elseif control==2 then
Kp=20;
Td=0.040;
Ki=0;
else
Kp=20;
Td=0.040;
Ti=0.150;
Ki=1/Ti;
end
Kd=Kp*Td;
Gm1=Gm/(1+Gm*Kd*s);K=Kp*(1+Ki/s);
Gm1K=Gm1*K;
Trans=Gm1K/(1+Gm1K)
roots(denom(Trans))clf();
mySys=syslin('c',Trans);
if graph==1 then
t=[0:0.005:1];
y=csim('step',t,mySys);
plot2d(t,y,5)
plot2d(t,y,5)
elseif graph==2 then
deff("[zramp]=ramp(x)","zramp=x"); //definition of ramp function
t=[0:0.005:1];
y=csim(ramp,t,mySys);
y1=ramp(t);
plot2d(t,y1,2)
plot2d(t,y,5)
elseif graph==3 then
deff("[zramp]=ramp(x)","zramp=x"); //definition of ramp function
t=[0:0.005:1];
y=csim(ramp,t,mySys);
y1=ramp(t);
y2=y1-y;
plot2d(t,y2,2)
plot2d(t,y2,5)
elseif graph==4 then
bode(mySys);
elseif graph==5 then
nyquist(syslin('c',Gm1K));
endif graph ==4 then
f=get("current_figure");
f.children(1).grid=[2 2];
f.children(2).grid=[2 2];
f.children(1).labels_font_size=2; //目盛の数字
f.children(2).labels_font_size=2; //目盛の数字
f.children(1).x_label.font_size=2;
f.children(2).x_label.font_size=2;
f.children(1).y_label.font_size=2;
f.children(2).y_label.font_size=2;
f.children(1).y_label.auto_position="off";
f.children(2).y_label.auto_position="off";
f.children(1).y_label.auto_position="on";
f.children(2).y_label.auto_position="on";
elseif graph<4 then
a=get("current_axes"); //get the current axes
a.grid=[2 2]; //make x,y-grid
a.labels_font_size=3; //目盛の数字
a.x_label.text="time[sec]";
a.x_label.font_size=3;
a.y_label.text="response";
a.y_label.font_size=3;
end
【5】DCモータ制御モデル(その2)で得たいくつかのグラフ
PD動作のステップ応答 Td=0.01, 0.02, 0.04のときの応答
clf()をコメントアウトすると複数のグラフを重ねることができる
control=2,graph=1
PID動作のランプ応答
Ti=無限大(Ki=0)のとき control=2,graph=1 遅れている
Ti= 0.15のとき control=3,graph=1 起動時に遅れるが,その後遅れ無し
Ti= 0.05のとき control=3,graph=1 発散してしまう
(clf()をコメントアウトすると複数のグラフを重ねることができる)
PID制御時のNyquist線図
Ti= 0.15のとき 線図をたどるとき,-1を左に見るので,安定
Ti= 0.05のとき 線図をたどるとき,--1を右に見るので,不安定
(clf()をコメントアウトすると複数のグラフを重ねることができる)